Description
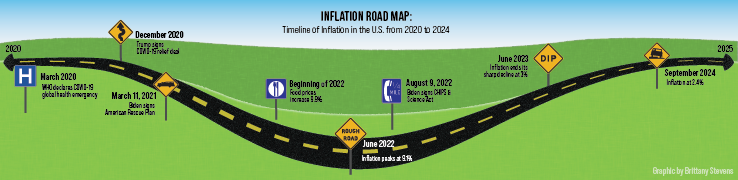
As a part of a special edition election issue of the paper, I was tasked with creating an info-graphic that would show a timeline of events that affected inflation in America from 2020 to 2025. The writer for the story approached me, and wanted more than a simple timeline but something that went along with another idea within the story, which was the rising costs of fuel in the United States. This lead to a car themed timeline.
The digital version of the story alongside the timeline can be found HERE!
Contributors
Brittany Stevens: Designer
Lydia Soltis: CM LIFE writer
Lydia Soltis: CM LIFE writer
Making a Difficult Topic Fun
Taking the idea of inflation and rising fuel prices and combining it with a timeline led Lydia and I to the idea of a road map. This road map leads you from how the pandemic and other factors affected inflation.
Road signs were used not only to indicate dates that things happened, but each of the signs also relates to the information that it is next to.